Be yourself; Everyone else is already taken.
— Oscar Wilde.
This is the first post on my new blog. I’m just getting this new blog going, so stay tuned for more. Subscribe below to get notified when I post new updates.
Be yourself; Everyone else is already taken.
— Oscar Wilde.
This is the first post on my new blog. I’m just getting this new blog going, so stay tuned for more. Subscribe below to get notified when I post new updates.
Data-Supported Decision Making
Data should be key in making a decision or when faced with a problem or situation that needs solving. Rather then drawing from our own intuition or our own beliefs and experiences to decide, an informed decision based on data should be made. Trapp (2018) says “, … it is much easier to obtain data – and to analyze it – than was thought possible even a few years ago,” and therefore should be used in the decision-making process. Data drives businesses and organizations because informed decisions, one would argue, would be the better decision than one made from intuition or gut-instinct. Education is most certainly a data driven organization. Teachers use student data to group their students, to adjust teaching methods and to judge student growth. Administrators and leaders at district levels use student progress data to make decisions about placement and use of its teachers and administrators, as well as many other uses for data in the field of education. Data is used in an immense amount if not all fields of study and businesses and even in the decisions made during everyday life. A tool that can be so powerful and so attainable in the technology driven society of today should not only be put to good use but should be appreciated for its power to create informed decisions.
Data Analytics Displayed
The data that was chosen and analyzed in the image below was retrieved from the Data.gov website where the data set from the National Center for Health Statistics concerning death rates and life expectancy at birth can be found. This analyzed data set displays the differences between the life expectancy and age-adjusted death rate by race and sex from the year 1900 to 2015. There are certainly trends that can be seen from the data that are interesting, yet not surprising, to be seen visualized in this way. The power given to this set of data by using a tool to display the data in such a meaningful way is irrefutable.
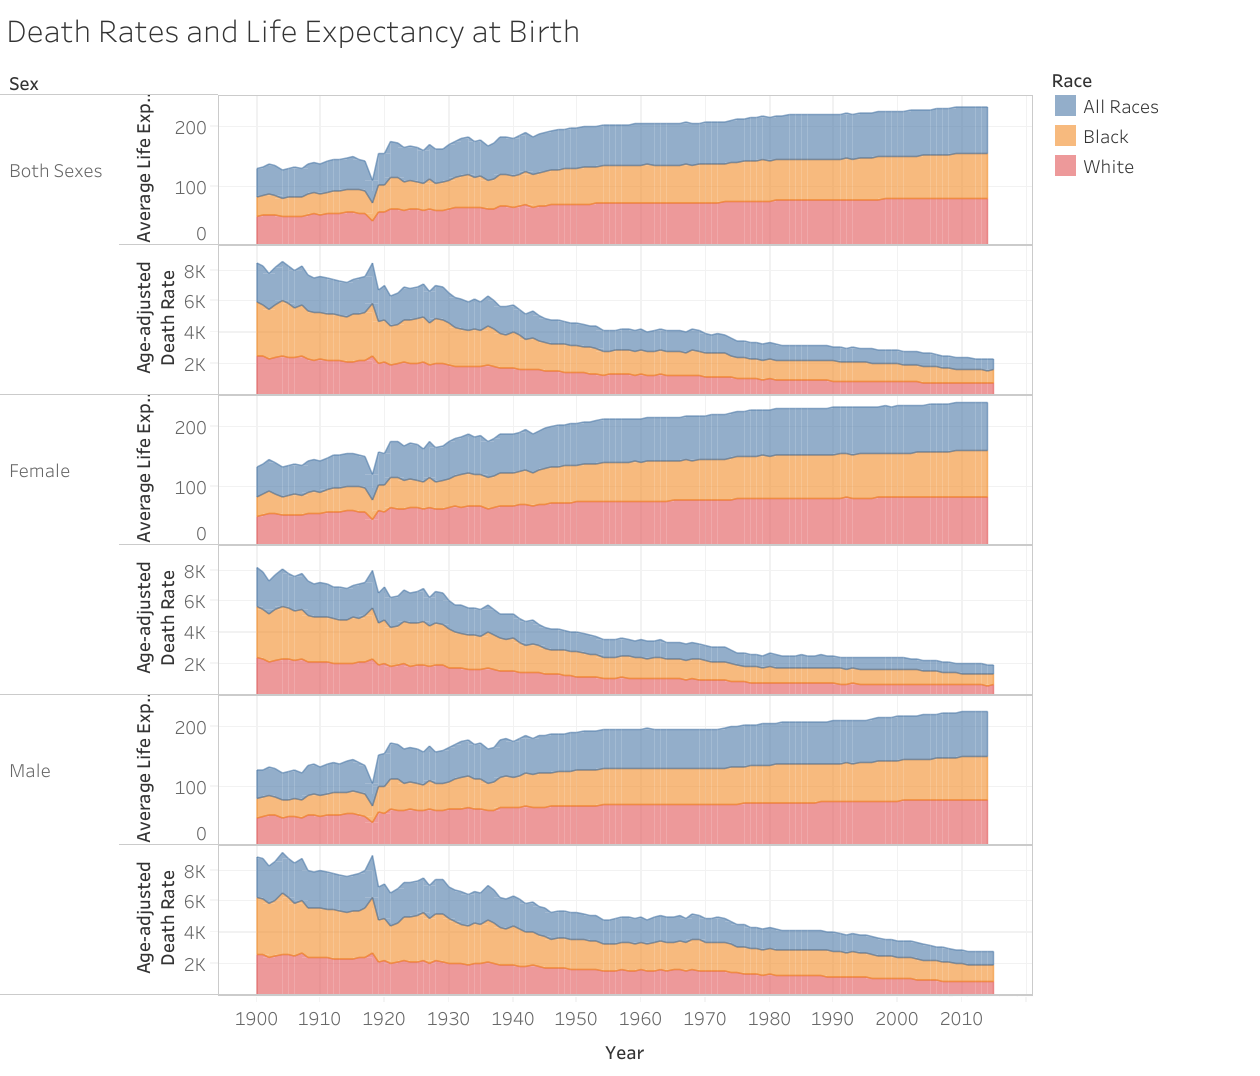
To view an interactive version of the data above, click Here
It comes as no surprise that over the years, as the life expectancy has increased the death rate has decreased across race and sex. One interesting trend to see visualized is that from 1900 to 2015 the difference between the life expectancy of black men and women and white men and women has gradually gotten smaller and has become virtually no difference between those two races at all. One aspect that would be interesting to research from this visualization is to look at the years where there seems to have been a drop or an increase in life expectancy and to research what, historically, may have been going on at the time. The implications of this data are immense.
Conclusion
The implication for using data to support decision making can be seen across many fields of expertise and in everyday life. Learning to become analytical thinkers rather than relying on intuition alone guides us in making better decisions about our lives in general as well as in our fields of study. According to Grafton and Grossman (2015) one becomes an analytical thinker “…when she attacks a problem that matters to her by identifying and mastering the sources” (37). Using a tool to create a visualization of a dataset has certainly instilled an appreciation for data analytics in that the power of the image and the capabilities of the interactive data are so tremendous.
References
Grafton, A., & Grossman, J. (2015). Habits of mind: Why college students who do serious historical research become independent, analytical thinkers. The American Scholar, 84(1), 31-31.
National Center for Health Statistics, Data Warehouse. Comparability of cause-of-death between ICD revisions. 2008. Available from: http://www.cdc.gov/nchs/nvss/mortality/comparability_icd.htm.
Trapp, R. (2018). How leaders can get better at using data to make decisions. Retrieved July 21, 2019, from https://www.forbes.com/sites/rogertrapp/2018/09/24/how-to-get-better-at-using-data-to-make-decisions/#cd5337233c7d
This is an example post, originally published as part of Blogging University. Enroll in one of our ten programs, and start your blog right.
You’re going to publish a post today. Don’t worry about how your blog looks. Don’t worry if you haven’t given it a name yet, or you’re feeling overwhelmed. Just click the “New Post” button, and tell us why you’re here.
Why do this?
The post can be short or long, a personal intro to your life or a bloggy mission statement, a manifesto for the future or a simple outline of your the types of things you hope to publish.
To help you get started, here are a few questions:
You’re not locked into any of this; one of the wonderful things about blogs is how they constantly evolve as we learn, grow, and interact with one another — but it’s good to know where and why you started, and articulating your goals may just give you a few other post ideas.
Can’t think how to get started? Just write the first thing that pops into your head. Anne Lamott, author of a book on writing we love, says that you need to give yourself permission to write a “crappy first draft”. Anne makes a great point — just start writing, and worry about editing it later.
When you’re ready to publish, give your post three to five tags that describe your blog’s focus — writing, photography, fiction, parenting, food, cars, movies, sports, whatever. These tags will help others who care about your topics find you in the Reader. Make sure one of the tags is “zerotohero,” so other new bloggers can find you, too.
